Click here for a downloadable PDF (1.5MB) of this report.
Bay Area Rapid Transit (BART) and Santa Clara County Valley Transportation Authority (VTA): San Francisco Bay Area, CA
Dallas Area Rapid Transit (DART): Dallas, TX
Massachusetts Bay Transportation Authority (MBTA): Boston, MA
Metro: Baltimore, MD
Metro: St. Louis, MO
Tri-County Metropolitan Transportation District of Oregon (Tri-Met): Portland, OR
Washington Metropolitan Area Transit Authority (WMATA): Washington, DC
Introduction
This report documents the first task in the process: a survey of best practices for facilitating successful TOD, as employed by other agencies, to be used as a basis for developing guidelines for GCRTA. This “Lessons Learned” methodology offers the opportunity to utilize the most effective guidelines, without repeating the time- and money-consuming processes of attempting all approaches. The TOD practices of the following seven transit agencies were investigated and are documented within this report:
- Bay Area Rapid Transit (BART) and Santa Clara County Valley Transportation Authority (VTA);
- Dallas Area Rapid Transit (Dallas, TX);
- Massachusetts Bay Transportation Authority (Boston, MA);
- Metro (Baltimore, MD);
- Metro (St. Louis, MO);
- Tri-Met (Portland, OR); and
- Washington Metropolitan Area Transit Authority (Washington, DC).
This report offers the following for each system (where applicable):
- Background for TOD initiatives;
- Valuable case studies (with comparisons of policies, for cities with multiple transit systems);
- Key lessons learned; and
- Recommended guidelines for GCRTA (and other systems) to utilize when developing TOD policies
TOD in Practice
The five case studies presented below offer instructive examples of varying approaches to TOD that have each yielded different measures of success. While not all of the cases involve explicit joint-development projects, each illustrates the benefits of coordinating public, private, and community involvement in order to extract real benefits from TOD investment.
Bay Area Rapid Transit (BART) and Santa Clara County Valley Transportation Authority (VTA): San Francisco Bay Area, CA
Background
The San Francisco Bay Area, a region encompassing a population of nearly seven million, has actively embraced TOD over the past two decades. Sprawl, spiraling housing costs, chronic traffic congestion, and environmental concerns have all fueled the interest in using transit service to direct growth throughout the Bay Area. Private interests, not-for-profits, and public agencies have all invested time and money in pursuing TOD projects.
The area includes nine county governments, several regional agencies, more than 40 transit agencies, dozens of local governments, countless nonprofit organizations, and local and national developers. Such intense interest in TOD by so many different groups has often resulted in an ad hoc and fragmented regional approach.
While many planners and professionals in the region understand the importance of coordinating activities across jurisdictional boundaries, strong home-rule dominates, and the parochial instincts of localities and special districts have often thwarted progress in this area. Development continues to unfold in a largely ad hoc fashion, making the oftenexpressed regional goals of Smart Growth and coordination of transportation and land use more conceptual than real.
Each group has carved out its role in the TOD planning process and employed its own implementation tools and strategies. Goals and objectives of the many actors are not always aligned. The result is several successful yet detached projects that have minor overall impacts on regional transportation and development patterns.
Still, Smart Growth principles resonate in many quarters of the region. Market conditions remain ripe for TOD in much of the Bay Area, and a growing number of real estate developers are positioning themselves to fill the continually expanding niche for railoriented living.
In recent years, regional agencies that could plant the seeds for future Smart Growth and, more specifically, TOD have introduced several important initiatives. Initiatives from three such regional entities—the Association of Bay Area Governments, the Metropolitan Transportation Commission, and multiple Congestion Management Agencies (CMAs) — provide small but important steps toward creating a future metropolis that is more transitsupportive in its design and composition.
Regional Agencies
Association of Bay Area Governments
The Association of Bay Area Governments (ABAG), the region’s council of governments, guides land-use, housing, economic development, and environmental planning. Local land-use decisions and zoning however are left to individual municipalities, and ABAG does not have the power to change land uses or density requirements. ABAG has nonetheless sought to build a collective regional vision that places the Bay Area on a more sustainable, Smart Growth path.
In 2000, ABAG embarked on a visioning process with five other regional agencies: the Bay Area Air Quality Management District, the Bay Conservation and Development Commission, the Metropolitan Transportation Commission, the Regional Water Quality Control Board, and the Bay Area Alliance for Sustainable Communities. Through a series of workshops with residents and stakeholders across the nine Bay Area counties, a series of Smart Growth policies were agreed on, including the promotion of TOD. Although these Smart Growth policies are not enforceable, they focus attention to TOD and encourage individuals and agencies to consider long-term and spillover impacts of development decisions.
Based on the Smart Growth policies, ABAG altered its methodology for its official projections of population, housing, and employment growth for the region. The projections are now based on assumptions that growth in the Bay Area will follow Smart Growth principles. Since its projections are used to determine funding and priority for infrastructure improvement projects, especially for transportation, the new methodology may result in greater local knowledge of, and funding for, TODs.
Metropolitan Transportation Commission
In 1970, the California State Legislature separated the responsibility of regional transportation planning from the Association of Bay Area Governments (ABAG) and created the Metropolitan Transportation Commission (MTC). The MTC is the region’s Metropolitan Planning Organization (MPO), controlling the allocation of Federal and state funding for transportation projects throughout the nine-county Bay Area.
In 1998, the agency created the Transportation for Livable Communities (TLC) program to provide funding for projects that “strengthen the link between transportation, community goals and land use.”1 The TLC program has evolved over the past five years to include three components: capital grants, planning grants, and the Housing Incentive Program. TLC allocates $27 million per year (from Federal transportation funds, and state Transportation Development Act monies) to local and county projects that meet various “Smart Growth” criteria defined by the MTC. This program has materially enhanced TOD activities in the Bay Area by providing funds for strategic planning and construction of ancillary improvements around stations, including bicycle and pedestrian amenities and compact housing.
CMAs
Congestion Management Agencies (CMAs) are statutorily responsible for coordinating countywide transportation planning and funding through a Congestion Management Plan (CMP). The CMP is a short-range plan that dictates how gas-tax funds are spent on transportation projects. California law requires all counties with more than 50,000 inhabitants to prepare a CMP, a condition that was mandated as part of the 1991 statewidededicated sales tax referendum.
CMAs in the Bay Area have taken various approaches in support of TOD, including: creating a sliding-scale for projects that reduce traffic-generation estimates for projects near rail stops and serving as facilitators or mediators in the TOD planning process.
Transit Agencies
Among the region’s 40 transit agencies, two major operators, the Santa Clara County Valley Transportation Authority (VTA) and the San Francisco Bay Area Rapid Transit District (BART), have been the most active in pursuing TOD.
Santa Clara County Valley Transportation Authority (VTA)
The VTA began looking for joint-development partners as it was completing its 21-mile, 30- station, light rail system (see Figure 1). The agency had separated from Santa Clara County in 1995 and merged with the local congestion management agency, thereby taking on responsibility for reducing traffic and analyzing the impact of local land-use decisions on the regional transportation system.
Figure 1 VTA Service Area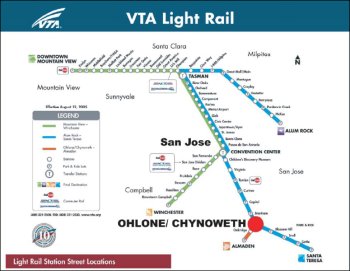
As part of this responsibility, the VTA coordinated with the city of San Jose to stimulate investment around several stations. The agency owned large parking lots next to many of its stations, and the agency began preparing station area plans that provided market data and design concepts for development. By 1998, VTA had created an in-house joint development program principally to tap the development potential of these underutilized park-and-ride lots for greater land use potential.
BART
Suburban BART stations, which began providing intra- and inter-urban rail service to the San Francisco and Oakland region in 1973, were expected to generate new centers of development in their communities, and guide suburban growth along a few corridors. Ten years after the arrival of BART services, most of these communities remained unchanged, surrounded by open fields and scattered single-family houses. It became apparent that the presence of a popular transit station was not enough to reshape the suburbs.
To date, BART has approached TOD and joint development cautiously. Rather than outright deal making, the agency has opted mainly to co-participate with local and developer interests in promoting transit-supportive development in the vicinity of stations.
After two slow decades, BART’s joint development activities are today taking off. In total, BART has more than $1 billion in joint development projects in the works, some still on the drawing board, and others, such as the Fruitvale Transit Village, that have broken ground and are well on their way to completion. To accommodate a joint development venture between the City of Hayward and a private developer to build a new city hall and multifamily housing close to the Hayward Station, BART swapped land with the City. The City of Hayward proceeded to sell the swapped parcel to a developer who built 77 townhomes. The City did not have to write down land costs because transit oriented, mixed-use development added enough value and property tax proceeds to render a subsidy unnecessary.
What historically hampered the ability of BART to engage in joint development deals has been the agency’s “one-for-one” parking replacement policy, which requires that TOD projects provide a competitive rate of return for the value of agency-owned land. Thus, the agency supported only those projects that could cover the cost of replacing surface parking (which today can run up to $75 per square foot). This has proven to be a lofty hurdle, leaving most of BART’s potential development sites as surface parking lots.
Even if BART’s board were to relax the one-to-one replacement requirement, parking supplies might not change, since local jurisdictions usually require that BART replace parking displaced by development on agency land. An essential component of BART’s recent joint development efforts has been outreach to local cities and other government agencies with a vested interest in seeing TOD move forward.
BART Reaches Out to the Community
BART begins joint development efforts by asking residents living near transit stations to identify what they want to see, what services their community lacks, and what unique assets should be stressed.
The contrast between VTA and BART policies and practices concerning joint development on agency-owned land demonstrates different agency philosophies and approaches. Without the burden of a one-to-one replacement parking policy, VTA has been able to take an entrepreneurial stance, working with private interests to build mixed-use projects on former surface parking lots. BART’s more restrictive policies on parking have historically tied its hands in pursuing TOD on agency-owned land. Only when an abundance of resources can be mustered to replace surface parking with comparably expensive parking structures, as occurred at the Fruitvale BART station, will an intimate connection between a suburban station and its surrounding community be achieved in BART’s service jurisdiction.
Bay Area Case Study: VTA’s Ohlone-Chynoweth Station
Developed with the needs of low-income families in mind, Ohlone-Chynoweth Commons comprises housing and community facilities located on the former site of an underutilized 1,100-space park-and-ride lot along San Jose’s Guadalupe light rail line (see Figure 2). This joint development between the VTA and Eden Housing, Inc., created 194 units of mediumand high-density affordable housing in a city where housing prices have skyrocketed over the last several years. The development also features a childcare center for use by residents and transit riders, a computer learning center, and a variety of recreational amenities, including tot lots and a bicycle/walking path.
Figure 2 Ohlone-Chynoweth Commons, San Jose, California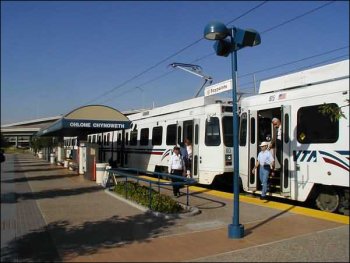
Ohlone-Chynoweth Commons is part of the VTA's larger effort to integrate transportation and land use planning. The agency has actively pursued a number of projects as part of its strategic TOD program. In 1993, the agency produced TOD Design Concepts for Santa Clara County to serve as a guideline for development.2
The VTA has varied their approach to joint development depending on the specific situation at each station. These include concept planning for many stations along the Tasman West light rail line as well as three ambitious joint development projects that replace portions of underutilized park-and-ride lots while providing much-needed housing. This joint development program has the following goals:
- Enhancing the quality of the station environment;
- Improving the linkages between transit and the community;
- Encouraging transit system ridership; and Generating revenue for the transit system.
The VTA set a new precedent when it undertook what it refers to as a “tranodominium” joint development project on the park-and-ride lot adjacent to the Ohlone-Chynoweth Station to develop Ohlone-Chynoweth Commons.
With monthly rents in San Jose averaging $1,432 in 2002 (up by approximately 22 percent from 2001)3, housing affordability is a major issue in the City as well as in the surrounding region. Families are willing to live at ever-increasing distances from employment centers, and the impacts on the region’s economy, traffic, and overall quality of life are enormous.
Positioned along the 20-mile Guadalupe Rail Line at the Ohlone-Chynoweth Station, the Ohlone-Chynoweth Commons site was identified as an ideal location for a joint development project for several reasons, including:
- The Guadalupe line offered service to large and growing employment centers to the north;
- The VTA had projected that future demand for the park-and-ride lot would leave significant available land that could be put to a higher use; and
- The owners of the adjacent site also were planning to develop multifamily housing, which would reinforce and support VTA’s goals.
The Federal Transit Administration’s revised joint development policy was instrumental in the agency moving forward with this initiative. In 1999, VTA and the City of San Jose released an RFP to build on part of the parking lot; the RFP originally did not include affordable housing. Tepid developer interest prompted a change of focus to constructing affordable units on the site, and a not-for-profit developer was selected as master developer.
Initially, there was considerable community opposition to this project because of the proposed concentration of affordable housing in the area. Support from interest groups as diverse as the Sierra Club, Silicon Valley Manufacturers Association, and Greenbelt Alliance helped the public review process. These advocacy groups, representing environmental interests on one extreme and high-tech industry interests on the other, supported the link between affordable housing and transit. With such a breadth of support for TOD, NIMBY resistance was quelled.
The project’s residential density comes in at 27 units per acre and just under 2 parking spaces per dwelling unit. All of the housing units were rented before construction was completed. However, the retail component is not fully occupied, and retail rents are below market value. This may be because the retail area is not easily accessible from the main street and is set back behind the primary VTA park-and-ride lot.
The project includes 100 percent affordable housing. It serves families with household incomes between 30 and 60 percent of the region’s median income (the U.S. Department of Housing and Urban Development set San Jose’s median family income at $96,000 in 2002), with rental prices set on a sliding scale according to income and unit size. Because of the overwhelming demand for affordable housing in the region, very little marketing was needed to promote the development. Leasing began in November 2000 and the apartments were fully occupied by March 2001. Demand continues to be strong, and a waiting list is maintained for future tenants.
A small grocery store utilizes 1,500 square feet and a florist, a coffee shop, and a hair salon occupy the remaining retail square footage. Because the retail is not visible from the street there has not been as much demand for the retail services as initially anticipated. As a result the retail space eventually may become office space.
The total development cost for the project exceeded $30 million. The City issued $14.2 million in tax-exempt bonds, backed by a standby letter of credit from the Federal Home Loan Bank of San Francisco. The City also provided a $5.2 million loan as part of its efforts to support the development of affordable housing. Pacific Gas and Electric, now Union Bank, furnished $10.5 million in tax-credit equity for the project. The MTC gave a $574,000 grant (using urban mass transit funds) for landscaping and improvements to the station. The Federal Transit Administration provided a $250,000 grant to reconfigure the bus transfer center at the light rail station. An additional $500,000 was provided by an affordable housing grant from Federal Home Loan Bank and $350,000 was made available in State Proposition A funds to reimburse the school impact fee required for housing development.
Dallas Area Rapid Transit (DART): Dallas, TX
Background
Dallas is an example of a place where market factors, rather than supportive public policy, are leading the push for TOD. Since the opening of the Dallas Area Rapid Transit (DART) light rail system in 1996, The Dallas Morning News reports that more than $800 million in new commercial and residential investment within walking distance of the DART line either has been constructed or is being built. This has happened without any subsidies, transit-oriented development (TOD) planning, or supportive policies by the regional planning agency, the City of Dallas, or DART along the starter line.
Unlike other regions, where the central city initially takes the lead role in promoting TOD, the City of Dallas has largely adopted a “wait-and-see” approach to TOD. The TOD leadership in this property-rights-friendly state, where government and planning have historically had relatively limited roles, has come from suburban communities and the region’s transit authority.
What has done most to kindle interest in Dallas’s growing (and increasingly traffic-choked) suburbs is the TOD success story at Mockingbird Station. North of downtown Dallas, the Mockingbird Station project capitalized on private developer initiative, strong local demographics, and an abundance of adjacent regional attractions. Following its success, committed local officials from the City's first-generation suburbs have begun to work with savvy developers to proactively plan and develop additional station areas.
TOD in these communities is helping to create unique downtowns designed to attract growth that would otherwise go to the sprawling regional fringe. In Plano, for instance, discussions have begun regarding whether to convert its end-of-the-line Parker Road Station from a large park-and-ride lot to a TOD. Preliminary TOD planning is underway for DART’s next round of extensions as well, slated to reach Irving, Carrollton, and Farmers Branch in 2008 to 2010.
To date, the City of Dallas has done little to promote TOD; business leaders have been more concerned that DART keep its facilities safe and clean than in how they might be used to leverage development. This however, may be changing. The City has recently added a full-time TOD specialist to its planning staff and is also in the process of designing a TOD overlay zone. DART continues to encourage the City to take positive steps, and it is widely expected that Dallas will assume a greater role in coming years.
Regardless of the extent to which the City of Dallas gets involved, powerful market forces are anticipated to continue to drive regional TOD. The Dallas Metroplex continues to sprawl, and, despite the generous supply of tollways, beltways, and expressways, congestion has steadily worsened. Real-estate market data provide further support for TOD in the region. A recent study found that, between 1997 and 2001, residential properties near DART light rail appreciated 39 percent more than properties further away from rail. For office properties, land-value premiums were even higher at 53 percent.4 As office competition in the far suburbs has intensified, investors are now looking for properties closer to popular DART lines, where occupancies and rents have been higher.
DART
DART serves the City of Dallas and 12 surrounding municipalities with 44 miles of light rail service connections, 34 stations, and more than 130 local and express bus routes (see Figure 3). The light rail “starter line” opened in 1996, and service was extended to Garland and Plano in late 2002. Today, average weekday light rail ridership is approximately 55,000. In addition, DART operates the Trinity Railway Express commuter line, which connects to Dallas-Fort Worth International Airport and downtown Fort Worth. In total, DART moves more than 200,000 passengers per day across its 700-square-mile service area.
DART does not have a formal TOD program (named as such), but promotes transitsupportive growth via economic development activities and programs. According to DART TOD specialists, this gives them greater flexibility to get involved in a broad range of projects that could potentially affect DART ridership.5 TOD planners spend about half their time educating cities and developers about the benefits of TOD via general publications and focused consultations and the other half coordinating detailed station designs with DART engineers and local municipal staff.
To promote TOD directly, DART employs a variety of tools. The agency has a designated staff person to act as liaison to developers supportive of the agency’s TOD vision. DART completes market research for each station, and develops brochures summarizing development opportunities at each one.
Figure 3 DART Service Area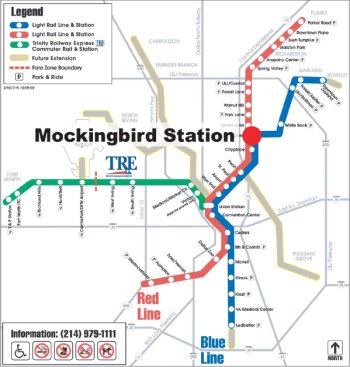
For its Arena Station, DART sold air rights, beginning at 26 feet above ground, for 55 percent of the land value, prior to station construction. At another, DART is in the process of selling surplus parking to an affordable-housing developer. In other cases, DART has proactively acquired surplus property to one day be exchanged for station-area infrastructure and TOD development.
DART’s in the Middle of the Action
DART’s station designs reveal particular attention to station placement plus bus and pedestrian linkages. When it can, DART tries to locate stations in the “middle of the action” and locate transit support facilities at the edge of activity areas. At the I-90 station, for instance, DART strategically located the platform in the middle of a large development parcel that is under single ownership (i.e., a potential future TOD) and built a 400-foot pedestrian walkway to provide a direct connection from the parking to the platform.
Dallas Case Study: Mockingbird Station
While there has been significant development next to DART stations, it has mostly been “transit adjacent” rather than transit oriented. The Mockingbird Station project, however, is an exception to the rule. The developer consciously sought to tap into the transit system to bring the ambience and energy of classic cities such as Paris and New York to Dallas.
Mockingbird Station is an urban-styled, mixed-use village named after and linked to an adjacent DART station via a pedestrian bridge (see Figure 4). It is the first mixed-use project in Texas specifically designed and built for a light rail station. The project includes 211 loft residences, 140,000 square feet of office space, and 180,000 square feet of restaurants, entertainment, and destination and convenience shopping that serve a predominantly upscale clientele. Additionally, there is a full-service grocery store and roughly ninety other shops within a five-minute walk of the station.6
Figure 4 Nightlife at Mockingbird Station, Dallas, Texas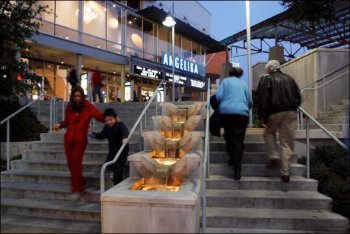
The project is located four miles (an eight-minute train ride) north of Dallas’s Central Business District. Strategically located at the intersection of a major east-west arterial, and the North Central Expressway, the project lies immediately adjacent to Mockingbird Station, the initial terminus of the 20-mile DART light rail system. Daily light rail ridership currently exceeds 38,000, and by 2010 DART projects an average of 185,000 daily passengers once two rail extensions begin providing direct service to from Mockingbird Station to Garland and Plano.7 The station is also a major bus transfer center.
The project is in the vicinity of Southern Methodist University, featuring the new Meadows Art Museum and the 32,000-seat Gerald J. Ford Stadium, and is linked to the campus via dedicated shuttle service. These and other attractions are expected to draw people from around the region to the area. The development is also located near the Katy (hike and bike) Trail and White Rock Lake, two regional recreational resources, and lies directly across from Highland Park, one of Dallas’s most prestigious neighborhoods.
Development began in 1997 with the private purchase of a seven-acre site containing an abandoned Western Electric building on Mockingbird Lane. In 1998, the developer purchased the Guaranty Federal Bank building and parking structure, an office tower next to the Western Electric building, adding three acres and giving the proposed project direct access to the freeway to complement the light rail access.
Critical to the project’s success, purchase of this site enabled the construction of 1,150 underground parking spaces for future residents, workers, and customers. It also made it possible to convert part of the existing six-story office parking garage into a 35,000-squarefoot retail space for a Virgin Records Megastore. The office building was subsequently renovated and expanded to 140,000 square feet. Below the office tower and adjacent to the parking structure are retailers including clothing stores, restaurants, and cafés.
At the northwest corner of the site is an eight-screen film center and café, which features independently produced films and includes below-grade parking. The theatre can be directly accessed via the pedestrian bridge that connects the development with light rail and bus service as well. A grand staircase links the theater to shops, offices, and lofts.
The Western Electric warehouse was renovated and four stories were added to construct 200,000 square feet of loft apartments. Most of the 50-year-old brick walls have been exposed and the large jalousie windows were retained. The building is topped with a distinctive arched roof recalling the bowstring trusses of the original building—a design touch frequently employed in 19th-century railroad terminals. The rooftop houses a garden and a 25-meter Olympic standard pool. The ground level has 45,000 square feet of retail space including Gap and Urban Outfitters.
Historically, the City of Dallas has made no changes to its plans or zoning codes to promote or allow TOD, although DART reports that municipal planning staff is now developing a transit overlay district.8 Both land parcels at the Mockingbird Station site were already zoned for mixed-use development, so there were no zoning obstacles to overcome. Build-out development densities are higher than those of the surrounding area, but are below the maximums allowed. No other TOD projects are located nearby.
One area of concern is a current lack of adequate public infrastructure and pedestrian amenities, which have been built in a piecemeal fashion. For example, sidewalks are undersized, discontinuous, and immediately adjacent to traffic. To design the infrastructure, the City selected an architect without first issuing a request for proposals and subsequently exhausted the project budget without obtaining adequate designs.
Although the developer has urged the City to allocate more funds to design high-quality infrastructure worthy of the upscale development, the issue remains unresolved. In the future, developers may be able to obtain funding for pedestrian improvements from the North Central Texas Council of Governments, which recently established a Sustainable Development Fund of $22 million to pay for improvements.
Most coordination with the public sector has revolved around designing and building the pedestrian bridge linking the development directly to the light rail, requiring the developer to coordinate closely with DART. As the light rail was already operational prior to the project kickoff, there was no opportunity to change the location of the station, which sits in a deep below-grade trench and was designed to incorporate a future pedestrian bridge to the west. Despite the high construction costs and the potential for increased transit ridership, no subsidies were provided by DART or the City for the bridge.
The transit station, which includes a newsstand and a coffee shop, essentially serves as the “front door” to the development. According to the developer, “The proximity of the DART station and growing ridership made the Mockingbird Station project attractive and doable, and we’re not doing it halfway.”9 Thus, the landscaped pedestrian bridge connects to other pedestrian amenities within the site, including several gardens and a public courtyard with a waterfall. Throughout the project are extensive landscaping, streetscaping, and use of native materials such as Austin stone.
Federal contributions toward local infrastructure and the City successfully applying to have developer-provided pedestrian improvements along Mockingbird Lane counted as a local match for state funding (a Statewide Transportation Enhancement Program grant) represent the only public funding for the project.
Project funding has been provided by the State of Michigan Employee Pension Fund, which picked the investment specifically to study the benefits of TOD. Although the development represents a new investment product for the fund, the developer reports that no notable hurdles were encountered that can be attributed to transit’s proximity or to the mixed-use buildings.
At Mockingbird Station, retail space currently rents for approximately $15 more per square foot than average Dallas retail rents. Residential rents are $1.52 per square foot, whereas comparable neighboring apartments rent for $1.25 per square foot (20 percent higher). While the City allowed the developer to build as little as 1,600 spaces by granting a mixeduse parking reduction credit, it refused to reduce parking further to reflect transit’s proximity. The developer estimates that he may have needed to provide only 1,300 spaces. The developer acknowledged however that some tenants may have resisted the lower figure.10
Massachusetts Bay Transportation Authority (MBTA): Boston, MA
Background
Boston is an ideal transit story, with a long, rich tradition of transit-shaped development and a healthy present-day economy. Boston’s transit market share for commuting is the third highest in the country at 33 percent11, slightly behind Washington, D.C. In addition, many of Boston’s suburbs experience significant transit usage.
One of the oldest cities in the United States, Boston’s built form, characterized by a pedestrian orientation; an intertwining of business, retail, and residential buildings; and close access to public transportation, highlights the non-motorized transportation around which it developed. Today, nearly all of the City proper lies within a short walking distance of a transit station. In a city where nearly all development is transit-adjacent, the challenge in Boston is to promote development that is truly oriented to transit.
Following decades in which the City, like most others in the U.S., neglected transit for the sake of auto mobility, popular pressure to save traditional neighborhood qualities in Boston has led to a resurgence of TOD. Public officials recognized the connection between these eroding qualities and the transportation systems around which their neighborhoods were oriented. The City responded by focusing transportation investments on modernizing and upgrading public transit. Significant steps in this direction included:
- The Governor of Massachusetts spearheading federal legislation passed in 197312 allowing the use of Federal highway funds for mass transit improvements and acquisitions;
- Investments in Massachusetts Bay Transportation Authority (MBTA) services including renovating and extending existing lines, reopening closed lines, and purchasing new rolling stock;
- A negotiated agreement with the federal Environmental Protection Agency that “froze” the number of allocated spaces in Boston at 1973 levels that prevented oversupplies of new parking in central Boston; and
- Constructing new MBTA rail stations without parking.13
This commitment to modern transit infrastructure has played a key role in generating private development interest in TOD. Coupled with a robust real estate market, this commitment has led to a minimal need for public subsidies to private developers for TOD in Boston.
Boston Parlays its Past
With nearly all of central Boston within ¼-mile of a transit station, TOD is the norm in Boston.The City’s approach to TOD is unique as a result, with a focus on maintaining the City’s historically transit-oriented urban fabric. The City of Boston has sought to strengthen transit’s presence by using regulations, incentives, and other tools. Such strategies include:
- Applicants for projects of 50,000 square feet or more are required to prepare transportation mitigation plans as an approval precondition;
- New developments are encouraged to improve and incorporate adjacent transit access facilities and stations;
- Economic development funds are used to increase police presence around problematic transit stations, encouraging private investment in surrounding residential buildings; and
- Foreclosed properties are consolidated and marketed for TOD, especially in targeted underdeveloped communities.
The Massachusetts Bay Transportation Authority
Predictably for a city where TOD was once the only form of development, much of Boston’s development is at least physically oriented to transit stations. This history however has limited some of the joint-development potential for the City’s transit authority, as large amounts of land surrounding transit stations were never owned by the transit agency. However, the Massachusetts Bay Transportation Authority (MBTA, see Figure 5) has actively sought to promote TOD opportunities on its suburban commuter rail lines where more land around stations is available, and it has promoted several air rights developments and small in-fill parcel opportunities within the cities of Boston and Cambridge. The conventional definitions of TOD and joint development do not fit easily in Boston, since the concepts have largely been conceived for the 20th-century suburban city prevalent in most of the country. Nonetheless, the MBTA has sought to maximize its influence on station area development. One step it took was to contract with TR Advisors (TRA), a private real-estate service company to identify opportunity areas for joint development.
Since 1996, TRA has worked with the agency to identify a pipeline of development opportunities The MBTA has been proactive in leasing or selling land and air rights at stations for development.
Figure 5 MBTA Service Area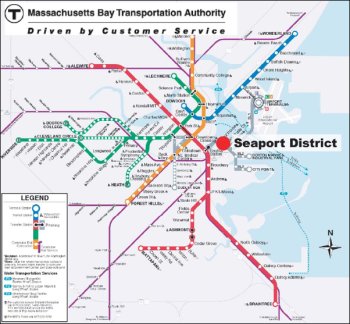
The MBTA also frequently works with developers of land not owned by the MBTA but adjacent to the transit facility to provide pedestrian and bicycle connections. For example in Cambridge, the City and the MBTA negotiated with the developer of CambridgeSide Galleria, an urban mall, to run shuttle buses every half hour from the two nearby “T” stops at Kendall Square and Lechmere Square. Presently, nearly 50 percent of the shoppers at the CambridgeSide Galleria walk or use transit. At Wellington Station in Medford, the MBTA worked with the developer to construction a pedestrian bridge over the rail yards connecting a major TOD development and commuter-parking garage to the Orange Line regional rapid transit station on the other side.
Office of Commonwealth Development
While the MBTA has been working on joint development independently, it has also received a renewed commitment from the Commonwealth of Massachusetts in the form of the Office for Commonwealth Development (OCD), created by the Governor in 2003. An oversight office charged with promoting sustainable development14, OCD has formed a TOD task force that includes the Secretaries of the Environment, Transportation, and Energy, and MBTA’s Real Estate and Planning Department. The purpose of this unprecedented partnership is to help Massachusetts secure Federal funding for new rail starts and to promote TOD throughout the state.
An important feature of the TOD task force is the educational program it has developed to inform community stakeholders throughout the commonwealth about the benefits of smart growth and denser development around transit nodes. This concept is often resisted, especially in suburban communities who frequently have zoning restrictions of one unit per acre or less. The state legislature passed an act known as 40R which provides funds to communities, agencies, and developers for the support of TOD. These funds can be used to promote pedestrian and bicycle connections to stations, and to improve public facilities that will enhance the TOD development overall. In addition, the Act provides funding for the municipality to receive sums to support the higher public service costs (such as education, police, and fire) associated with new, dense development.
OCD and the MBTA work with local communities to promote the use of surplus MBTA land near transit stations to catalyze high-quality, transit-oriented development. The program provides technical assistance for outreach, planning, marketing, and RFP development, following a basic four-step approach:
- The MBTA identifies surplus parcels of land for TOD;
- The MBTA works with the community to develop a TOD plan with development guidelines;
- Working collaboratively with the MBTA, the community supports the plan by adopting zoning changes or permitting variances; and
- The MBTA issues an RFP incorporating development guidelines developed with the community to identify suitable developers to purchase or lease, and develop the TOD site.
Boston Case Study: The South Boston Waterfront
Long anticipated as Boston’s Smart Growth frontier, the 1,000 acres of the South Boston Waterfront (or Seaport District) offer the City of Boston a rare opportunity to implement TOD across a district-wide urban infill project. The Seaport District was bustling with activity until the mid-1970s, when the marine and navy industries either closed or moved elsewhere. To make matters worse, the construction of the Central Artery formed a physical barrier between the Seaport and downtown Boston.
The isolation of the area contributed to making the South Boston Waterfront a site of underutilized and underdeveloped land. For most people, the South Boston Waterfront has been a forgotten place. The completion of the Big Dig project and the Ted Williams tunnel connecting South Boston to the airport are set to change that dramatically.
There have been redevelopment efforts in the Seaport District in the past, but none have been focused on transit opportunities. The TOD plan will be the largest and most comprehensive redevelopment effort to date for the waterfront. The aim is to create a lively, 24-hour, transit-oriented community. The success of transforming the Seaport into a TOD depends on the organization of transit in the neighborhood.
The key to TOD in the Seaport District is the MBTA’s newest rapid transit service, the Silver Line, linking the South Boston Waterfront to Downtown Boston’s South Station. For financial reasons, a decision was made to use Bus Rapid Transit (BRT), buses traveling along dedicated rights of way, rather than extending the subway line to the South Boston Waterfront. For the new line, the MBTA created a dual-mode/dual-propulsion system that operates as an underground electric bus around the Seaport, but becomes a low-emission bus traveling in bus-restricted lanes on City streets.
Two underground stations and two aboveground stations now serve the Waterfront District, offering roughly two-minute peak-hour headways. The South Boston waterfront will be a 7-minute, one-seat ride from South Station in one direction and from Logan Airport in the other. MBTA is forecasting 60,000 passengers per workday.
Most development will be within an easy walk of these stations. The construction of a tunnel under the Fort Point Channel now connects the waterfront with South Station where Amtrak, commuter trains, and the subway can be accessed. Using the Ted Williams Tunnel, the Silver Line also connects the Seaport District to Logan Airport.
The centerpiece of the District is the Boston Convention & Exhibition Center (BCEC), with 550,000 square feet of contiguous exhibit space and an adjoining hotel (see Figure 6). The site covers 60 acres and is projected to generate a high level of evening and weekend activity, minimal private automobile traffic, and extensive pedestrian trips to hotels, restaurants, and stores.
Figure 6 Hotels and Shopping at the Boston Convention & Exhibition Center, Boston, Mass.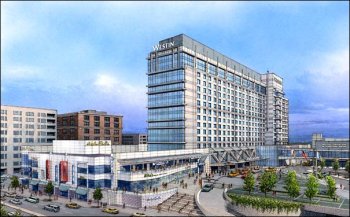
One block from the BCEC is a prime example of Boston-style joint development, the Silver Line station at the site of the World Trade Center complex (WTC). The MBTA, Massport, and a private developer agreed to construct the station below the landmarked 800,000- square-foot facility housing exhibition space and offices for high-tech and international trade companies. Each party brought something to the table that the other parties wanted. Massport owned the land; the developer owned the World Trade Center buildings; and the MBTA had the power to define station location.
The essence of the agreement concerned the sharing of costs and responsibilities for the station among the three parties. Massport provided the infrastructure; the developer bore the cost of construction, and the MBTA delivered the transit service. Both Massport and the developer were able to add value to their investments by vastly increasing access to the building, and the MBTA was able to increase ridership while defraying a large portion of the cost of a new station.
The Seaport District is also slated for high-density residential development. Two sites are planned for a total of more than 1,100 owner-occupied units. More housing will be needed, however, if the Seaport District is to become a true 24/7 neighborhood. The commercial and open spaces of the Seaport District are however moving along at a faster pace than residential space.
Boston’s commitment to making the Seaport District oriented to transit instead of adjacent to transit can be seen in the parking limits imposed on the area. A parking freeze, set in 1994 and amended in March of 2006, allows a maximum of 30,147 non-residential parking spaces in the district. In 2005, approximately 2,000 spaces were in a parking freeze bank, which can be allocated to new parking facilities. The actual number of facilities and spaces fluctuates as old parking lots close and new ones open.
This policy has proven significant in creating a default TOD framework for construction projects. High project densities and limited parking have resulted in South Boston’s development emerging with parking ratios typical to mature, transit-intensive downtowns, often less than one space per 1,000 feet of development. Such low parking ratios ensure that automobiles do not have priority over transit in the Seaport.
Boston Case Study: Ashmont Station at Peabody Square, Boston, Mass.
At the Ashmont Station, the MBTA entered into a long term ground lease with a developer to build a mixed-use development (see Figure 7) with first floor retail and 100 units of affordable housing on an under-utilized 30,000 square foot parking lot at its terminus for Red Line rapid transit, Mattapan Trolley, and a regional bus station. Proceeds from the development will go towards improvements to the aging station. In addition, the MBTA will receive a continuing payment of $25,000 per year to maintain a new plaza and landscaping at the station for the life of the lease.
Figure 7 Ashmont Station at Peabody Square, Boston, Mass.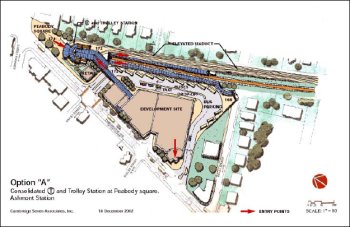
Peabody Square is a densely populated section of the Dorchester Neighborhood of Boston. Since this is a walk-in station, the barren parking lot was an eyesore and served to interrupt the streetscape. By developing first floor retail with housing above, the streetscape will be reconnected and will provide a vibrant pedestrian connection to the station. New retail space will enhance and solidify the commercial aspects of the Square, while the muchneeded affordable housing will provide new riders to the system and customers for the retail space. The MBTA, TRA, the developer and the neighborhood association worked closely together to plan the best use of this rather small parcel. So popular was the development concept, that it attracted the attention of the state legislature which decided to fund $65 million for the complete rebuilding of the MBTA’s station and reconfiguration of the bus turnaround instead of the original plan to only make modest critical improvements.
Metro: Baltimore, MD
Background
The 15.5-mile, 14-station Metro Subway system operates from the Owings Mills corporate and shopping complex in Baltimore County, through the heart of Downtown Baltimore’s business, shopping, and sightseeing districts to world-renowned Johns Hopkins Hospital (see Figure 8).
When the original 8-mile long Baltimore Metro opened in 1983, officials introduced the service as a no-frills subway line that would grow slowly and cautiously over the years. The route began with limited weekday service that terminated at 8 p.m., and no weekend service. By 1987, a 6-mile extension reached Owings Mills, a growing town northwest of Baltimore targeted by Baltimore County for long-term development. Another extension to Johns Hopkins Hospital opened in 1995.15 Today, weekday service now runs from 5 a.m. to midnight, with 42,000 daily boardings. Weekend service runs from 6 a.m. to Midnight. Though Baltimore Metro is only one route with limited ridership compared to many system, it has been well received by the community and has long-term potential to serve a greater market share.
Figure 8 Metro Subway Service Area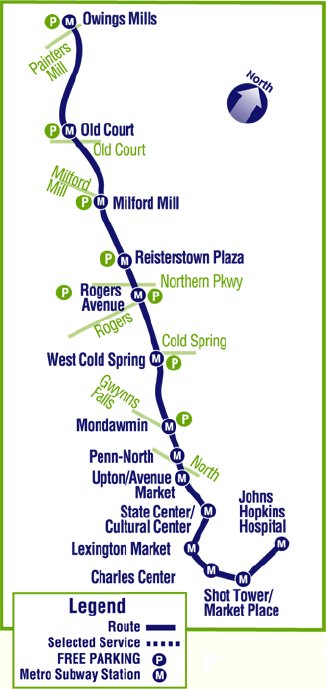
TOD Planning
A TOD project is currently being developed at Owings Mills. The last stop on the Metro, this station has the Metro’s second highest level of weekday boardings at 4,700. Baltimore County designated Owings Mills as a growth area and teamed with the Maryland Transit Administration (MTA) in putting forth an RFP for development of the 46-acre site around the transit station.16 The MTA put forth $15.1 million and the county $13.1 million. The County will also provide $16-$20 million for a community college and public library facilities.
Owings Mills Transit, LLC, a partnership between Baltimore County, the Maryland Transit Administration, and a private developer, will lead the project, called “Metro Centre.” The mixed-use development will surround the subway station and have a town center design.17 The complex will contain:
- 1.2 million square feet of office;
- 495 residential units;
- 225,000 square feet of retail;
- Restaurants;
- 40,000 square foot public library;
- 60,000 square foot space for Community College of Baltimore County;
- 250 room hotel; and
- 5 parking garages providing 11,130 spaces (two garages for transit users).
The land, owned by the MTA, was leased to the developer for 99 years, turning a capital asset into long-term operating revenue. Once the site is built out, the MTA also anticipates additional annual ridership revenue of $3.6 million. Metro Centre will capitalize on unused land by placing surface parking into garages. When the project is finished, it will contain 3,100 free commuter parking spaces. Although suggestions were offered to place parking away from transit to encourage circulation, at MTA’s insistence, the parking garages will sit next to the transit station.
Metro: St. Louis, MO
Background
St. Louis Metro’s MetroLink light rail opened in 1993 with 17.5 miles of track. One mile of the track runs underground, but the rest is above ground. Construction of the original MetroLink cost $425 million; a 17-mile expansion into Illinois cost $325 million. Nine more stations will open in September 2006 with a cost of $680 million, all of which comes from local funding. The low density of many areas around St. Louis spurred the choice for light rail as opposed to subway. MetroLink complements Metro’s regional bus service (see Figure 9).
Figure 9 Metro Service Area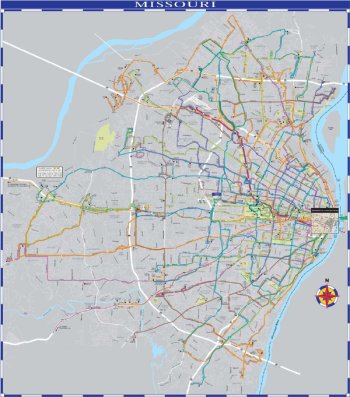
TOD Is Limited Without Planning
While significant development has occurred around the existing light rail stations, it has been transit-adjacent development more than transit-oriented development. A residential development around the Emerson Park station in Illinois sits next to the light rail but is still car-oriented and contains detached single-family housing.
Some infill has occurred in the City’s core, but any transit-oriented development that has happened is by accident, not design. Two developers have started projects around one of the new light rail stations. One developer built a typical suburban shopping center with a fence blocking users from the transit station. The other developer is building office mixed with retail, but has not planned specific connections to the station. Metro has not taken any leadership in working with developers, assembling land, or coordinating development.
Metro also lacks funding and influence to steer development. The nine new stations offer good possibilities for development since they run through a more affluent area of the City. Thus far, Metro has basically sold land to whoever comes up with an idea. While real estate market conditions create significant TOD barriers in the City, the lack of a coordinated public effort to proactively promote station-area development undermines TOD as much as anything in Saint Louis.
Tri-County Metropolitan Transportation District of Oregon (Tri-Met): Portland, OR
Transit and TOD planning are linked inextricably in the Portland region. The Portland region’s sustained commitment to TOD is part of its well-documented and vigorous pursuit of Smart Growth development. Its “2040 Growth Concept” features a tight Urban Growth Boundary within which growth is concentrated and local governments are required to limit parking and adopt zoning and policies that are consistent with the Strategy, which calls for two-thirds of jobs and 40 percent of households to be located in and around transit-served centers and corridors by 2040.18
Over 25 years, the region’s TOD approach has evolved from being an afterthought to an essential component of rail-facility planning. TOD has become part of the underlying policy framework of Portland’s comprehensive growth management at a community and regional scale. Today, sophisticated developers know that sites adjacent to transit are likely to come with development incentives, often making them more attractive than sites outside of the CBD.
Portland’s Priorities
Portland's core station area planning objectives include:
- Rezoning the influence area around stations to allow only transit-supportive uses;
- Recognizing that station areas are special places, whereas the remaining region is available for traditional development;
- Promoting TOD as part of a broader growth management strategy;
- Focusing public agency investment and planning at stations with the greatest development opportunity;
- Building a broad-based core of support for TOD with elected officials, local government staff, land owners, and neighborhoods; and
- Setting up a self-sustaining framework to promote TOD once the planning is complete.
Tri-Met
Portland’s regional transit-agency, Tri-Met, has been involved in TOD as an advocate, an educator, and a funder. The agency has been willing to provide substantial time and resources to further the implementation of TOD and the region’s vision. TriMet has also been a major beneficiary of regional growth policies. By orienting growth to transit service, such policies help fill TriMet’s trains and buses. Since 1990, TriMet’s bus and rail ridership has significantly outpaced growth in both population and vehicle miles traveled in its service area (see Figure 10).
Figure 10 Tri-Met's Service Area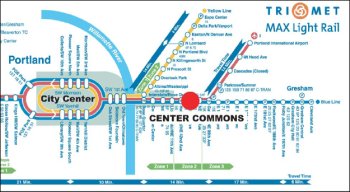
Metro
Portland’s regional government, Metro, has been a key player in Portland’s TOD success. Its TOD Implementation Program uses Federal transportation funds to help stimulate TOD construction. Operating with two full-time staff members, the program has been directly involved in the funding of 12 different TOD projects with a level of involvement ranging from site acquisition and control to direct financial participation in development projects.
According to a Metro associate, “Metro’s TOD Program pushes the development envelope by using public-private partnership techniques to secure more TOD-like projects than would otherwise be developed on a given site. For example, on a site where the free market would likely produce three-story apartments with surface parking and no retail, the TOD Program would push for five-stories with podium parking and ground-floor retail that may have four to five times more dwelling units and induce significantly more transit ridership.”19
Once plans are developed for property that Metro has acquired, it is re-parceled, and then sold to private developers under conditions to follow the TOD plan. Often the land value is written down to cover high development costs associated with specific TOD requirements. In such cases, Metro uses a “highest and best transit use” appraisal method to establish a sale price.
The program is the first of its kind in the United States to use flexible federal transportation funds for TOD implementation. Conversely, Metro’s framework has been instrumental in helping shape the joint development policies of the Federal Transit Administration.20
Other Players
The Congestion Mitigation/Air Quality (CMAQ) TOD Program operated by the Portland Development Commission (PDC) was originally funded with $3.5 million in Federal CMAQ funds. The money is used to acquire land and design and construct transit amenities as part of TODs. To date, a total of nine projects have received funding from this program.21
Additional agencies actively working on TOD include the State of Oregon’s Community Solutions Team, the Portland Development Commission (Portland’s urban renewal agency), and the cities of Portland, Gresham, Beaverton, and Hillsboro. A recent product of these collective efforts has been three new TODs: Center Commons, The Round, and the Pearl District.
Portland Case Study: Center Commons
The Center Commons is a mixed-use, primarily residential, community with 314 marketrate and affordable housing units located five miles east of downtown Portland (see Figure 11). The project is located approximately 1/4-mile from the 60th Avenue regional light rail station, which abuts the north side of a freeway. It is also within 1/3-mile of stops along three Tri-Met bus lines. Downtown Portland is just 19 minutes away by light rail.
Figure 11 Center Commons Community, Portland, Oregon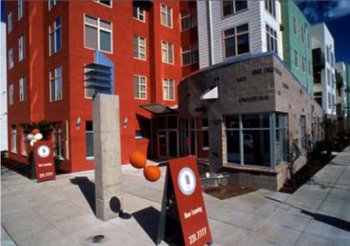
The Center Commons is notable in the Portland region for having gone the farthest in developing mixed-income and for-sale housing on a single site. In addition, it is the first major infill TOD along the freeway section of light rail within the City of Portland. Planning for the project began in 1994 with the City and the local neighborhood meeting to discuss how the site could be developed.
The neighborhood was receptive to the idea of building a TOD as long as it met the following conditions:
- Pedestrian safety and access to the light rail would be improved;
- The project would include open/recreation space;
- Building heights would be compatible with the surrounding neighborhood; and
- The site’s large oak trees would be preserved.
In 1995, the City’s redevelopment agency studied the feasibility of developing the 4.9-acre parcel using Transportation Growth Management funds from the state. At the time, the parcel contained a vacant one-story office building and a large surface parking lot used informally by park-and-riders and carpoolers. The study determined that a TOD project would fit well with Portland’s growth management objectives and the agency purchased the site for fair market value in 1996.
The site was located in a designated Light Rail Station Area in Metro’s 2040 Plan, and thus had no zoning barriers to TOD. Under the zoning, the site could include up to 500 housing units. The site was large and neighboring assets included a large local grocery store, a hospital, a stable surrounding neighborhood, and mature trees.
On the other hand, the site area had narrow sidewalks, congested arterial access, nearby industrial uses, and no local precedent for high density or mixed uses. Local commercial rents were too low for new construction. Furthermore, the light rail station’s location in the median of a noisy freeway median was less than ideal for anchoring a TOD community.
A 1996 development offering resulted in the selection of a proposal to construct more affordable housing than the preliminary development plan required, within the budget established for the project. The plan required that at least 40 percent of the constructed units be affordable, but the selected proposal reserved 75 percent of the project’s 288 rental units for residents making less than the area’s median income.
Soon, market-driven cost cutting and engineering considerations began to threaten some of the transit-supportive elements of the project, including mixed housing types and quality pedestrian networks. In early 1999, the Metro TOD program purchased the site at its appraised value subdivided the parcel, and established TOD easements, covenants, and restrictions to ensure that local residents could use on-site pedestrian paths to access the nearby light rail station. The property was then sold to three different development entities constituting the original development team, after the price for the land was reduced to $250,000 to reflect changing market conditions.
Environmental remediation on the site occurred shortly thereafter and included removing surface soil contamination to a highway roadbed, removing asbestos, and recycling the old concrete building as site fill. The developer paid for the remediation with assistance from the Oregon Department of Transportation, and project construction started in April 1999.
The Center Commons was completed in early 2001 and consists of four separate buildings, each serving a different clientele. Context-sensitive design used the mature oak trees to set some buildings back from the street. The largest buildings are concentrated on the edges of the property, facing the freeway and a freeway off-ramp, serving as a sound and visual buffer.
Development costs for the Center Commons TOD totaled $30 million. Funding sources included low-income housing tax credits, State of Oregon tax-exempt bonds, a PDC loan, a Fannie Mae loan, general partner equity, and an FTA TOD grant. Additionally, the project received a 10-year property-tax exemption.
A survey of the 288 rental apartments found that transit mode share increased nearly 50 percent for work trips (from 31 percent before to 46 percent) after moving into the Center Commons, and by 60 percent for non-work trips (from 20 percent to 32 percent). By comparison, transit work-trip mode share for the City of Portland was 12.3 percent in 2000.22 While the high number of low- income households is a major reason for the high mode share in general (76 percent of respondents had an annual household income of $25,000 or less), transit use has still increased significantly among new residents of Center Commons. The survey also found that proximity to transit was among the most commonly cited reasons for choosing Center Commons housing.23
Washington Metropolitan Area Transit Authority (WMATA): Washington, DC
Background
The potential for TOD to positively influence the Washington, DC region was established in part by the recognition on the part of the area’s local, regional, and national leaders that transit should shape growth in the region. Three local jurisdictions that were especially early in recognizing the benefits of developing around transit include: Arlington County, Virginia; Montgomery County, Maryland; and the District of Columbia (see Figure 12), all of whom began orienting land use planning to WMATA service before operations began.
Early TOD success was limited largely to downtown and upscale corridors within the District, as well as Arlington, Virginia and Bethesda, Maryland. The success of early projects however, has spurred interest in TOD as an economic development tool in lowinvestment District neighborhoods and as a congestion remedy in the region’s outer suburbs.
Figure 12 WMATA Service Area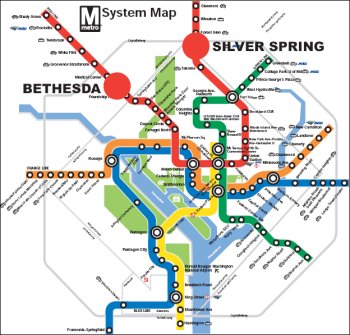
The Washington area enjoys one of the nation’s best modern-day rail networks. Demographically saturated by young professionals and couples without dependents, the area has one of the strongest urban apartment markets in the nation.24 Consequently, MetroRail accessible real estate sells and leases for a premium.
Arlington County remains one of the nation’s premier TOD leaders. Over the past 30 years, Arlington County officials, planners, and citizens have joined forces to employ various tools to steer high-density, mixed-use development along the County’s two major MetroRail corridors. Besides high tax yields from development that was attracted by the TOD development, high and balanced-flow ridership has been an important payoff.
Older suburban downtowns such as Bethesda and, more recently, Silver Spring in Montgomery County, Maryland, are also undergoing a TOD facelift. Progressive city and county policies, including density bonuses and flexible parking codes, have encouraged TOD in these areas. The region has long had transit-oriented commercial development; however, what one finds today are numerous housing projects breaking ground that are taking advantage of MetroRail’s proximity. Traffic congestion beyond the Beltway, a robust and fairly resilient job market, and new downtown amenities are boosting infill and redevelopment in the District and inner-ring suburbs near MetroRail stations.
Given the Washington area’s ideal demographics and solid economic outlook, combined with worsening traffic congestion, demand for transit-oriented living, offices, and retail shops will likely remain strong for decades to come.
WMATA – Joint Development Pioneers
For more than 30 years, the Washington Metropolitan Area Transit Authority (WMATA) has been actively working with private developers, lenders, and other public entities to leverage development opportunities above and adjacent to its rail stations. In its earliest days, the agency created an in-house real estate office and encouraged its staff to aggressively seek out mutually advantageous joint development opportunities. To date, more than 30 property sites in and around the nation’s capital have been developed through WMATA’s joint development efforts, using TOD to generate revenue and ridership, and to increase the agency’s prominence throughout the Capital region.
Created to build Washington’s rapid transit system, WMATA eventually gained authority of the region’s bus services, and today is the nation’s second largest public transit operator with more than one millions daily riders.25 Because of WMATA’s unique jurisdictional circumstances, the agency has never had a dedicated source of funding, relying instead upon contributions from various state and local governments within its service area. The agency’s early entry into joint-development, and value capture, activities have thus proven essential sources of funding stability.
WMATA’s first joint-development project was at the Rosslyn Metro Center, 700,000 square feet of mixed office and retail space, built directly above Rosslyn’s MetroRail station.26 Initiated in 1973, the project pre-dated the opening of the MetroRail system by three years. Thirty years later the agency’s joint-development projects numbered 52 and carried a market value of roughly $4 billion.
For its in-house development office, WMATA hired staff with real estate backgrounds and gave them the power to build a portfolio of land holdings. The agency has since benefited from this more entrepreneurial approach to land-use issues than is characteristic of transit agencies.
Today, joint-development TOD is standard practice at WMATA. All of its stations are methodically screened to gauge development potential. This approach has generated success in terms of ridership gains and revenue generation, as well as lifting the agency to national prominence.
WMATA’s success has not come without criticism. Most notably, regional observers have commented that the agency could be doing more to shape regional growth. In addition, local planners have lamented the agency’s slow pace, and the governor of Maryland cited WMATA’s ineffectiveness, particularly in inner-ring developments.27 The agency has responded by reviewing its TOD/ joint-development approach.
WMATA Takes the Lead
WMATA’s development staff is aggressive in seeking joint-development opportunities. In one case, following a lack of response to an RFP to develop around its Ballston MetroRail station, the agency sought interviews with area developers. These interviews revealed that developer reluctance was due to viability issues of the stand-alone parcel named in the RFP.WMATA began assembling adjacent parcels. They entered the eventual development as equity partners, rather than merely leasing out the land, allowing for the fee simple agreement necessary for condominium sales. By the early 1990’s, the project was generating $200,000 in annual revenues for the agency, and Arlington had a bold new TOD mini-city, 25 MetroRail minutes from the Capitol.
Agency staff identified the following as obstacles to generating creative development projects from within a large transit bureaucracy28:
- Cumbersome, slow project analysis and approval process;
- Inadequate marketing of development sites;
- Lack of community involvement;
- Lack of clarity of key business issues; and
- An increasing tendency to build projects that are adjacent to, rather than oriented to, transit.
In response to this critique, internal organizational changes have clarified responsibility for joint development and integrated departments to better facilitate development efforts. A classification system was developed with the assistance of a private real-estate firm as part of a portfolio market analysis. A select set of 24 potential development sites were divided into three categories:
- Level 1 sites are those with significant private-sector interest that will require little public-sector intervention. (Most of the sites are surface parking lots, which developers will need to replace, although the board is reviewing its policy to determine whether a one-for-one replacement will be required.);
- Level 2 sites have some private sector interest, but carry logistic or political constraints; and
- Level 3 sites are sites that suffer from a lack of private sector interest and require substantial public-sector intervention over a long period of time.29
The classification system helped target agency resources and underscore the level of commitment required to develop some of the more difficult sites. In addition to this new classification system, WMATA has developed TOD guidelines designed to attract new riders, increase revenues, and expand local tax bases. Some of the guidelines include30:
- Maximizing use of transit, not automobiles;
- Linking land use with transit, physically and functionally;
- Providing a diversity of housing types;
- Emphasizing mixed uses in high-density developments; and
- Creating special places.
WMATA Case Study: Montgomery County, Maryland
Bethesda and Silver Spring, in suburban Montgomery County Maryland, are both first-ring, inner Beltway communities with mature central business districts (CBDs). Both have enjoyed a significant amount of retail and office development concentrated around their respective MetroRail station.
Bethesda
Bethesda is the more affluent of the two suburbs, with some of the County’s highest property values and incomes. Extending north from Georgetown, Wisconsin Avenue runs through the heart of Bethesda. In 1970, as preparation began for the arrival of MetroRail, the County amended its master plan by reducing the size of the CBD boundaries to concentrate development around the station site. The plan also established a commercial transition zone to provide a buffer between the CBD and residential neighborhoods.
Bethesda’s CBD sector plan was amended in 1982 to ensure that the projects approved within the City’s core complied with the community’s goals, including transit-oriented, compact development. Encouragement of public-private partnerships has also enabled the City to meet its planning and transportation goals. In the late 1980s, the County enacted legislation authorizing the creation of an urban district in Bethesda in which properties are levied a special tax to pay for public services within the district. In the early 1990s, the Bethesda Urban Public/Private Partnership was created to control the distribution of the revenues collected in the district.
An exemplary model of the benefits of private-public collaboration is the Bethesda Row project in Bethesda’s CBD (see Figure 13). Bethesda Row is a large-scale, mixed-use redevelopment project on a site that covers seven contiguous city blocks and encompasses 13.5 acres of land. Currently, three of the four phases of the project have been completed, featuring 110,000 square feet of office space, 190,000 square feet of retail space, and 40,000 square feet of restaurants.31 The final phase will include art facilities, a movie theater, and possibly a residential component. The site is transit accessible, located within walking distance of the Bethesda MetroRail station. It is also adjacent to the Capital Crescent Trail, a regional bike and pedestrian path frequently used by bike commuters to access the District’s core.
Figure 13 Bethesda Row Project, Bethesda, Maryland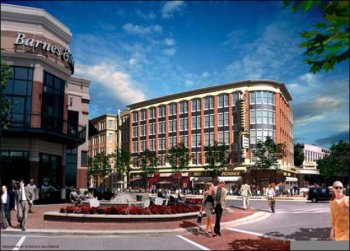
Bethesda Row’s developers funded the project through real estate investment trust financing and by phasing the project to both decrease development risks and create sufficient cash flow to cover future development costs. Montgomery County provided a significant funding source for the project by constructing a parking garage in the middle of the site using parking district funds.32
The developers worked with the County’s planners to ensure that the project complied with the City’s downtown master plan, and the parties negotiated streetscaping designs as well as the means for properly assessing the project’s traffic impacts.33 The developers also met with members of the community to address local concerns regarding the effect of national retailers on local businesses. In response, the developers incorporated a mix of local, regional, and national retailers to the project.
The project has been a commercial and community success. Office occupancy rates are near 100%.34 The retail component includes 53 stores with average annual sales at approximately $400 per square foot. The central location and diverse entertainment and restaurant facilities attract office workers and residents from nearby neighborhoods as well as from surrounding communities.
Silver Spring
Silver Spring’s downtown was a thriving business district in the 1950s and 1960s, but later declined in the face of suburban mall competition. The surrounding neighborhoods encompass a wide range of incomes, and the community benefits from a rich diversity of residents and employees. The Silver Spring MetroRail station, originally a terminus, was sited somewhat outside of the existing downtown.
In Silver Spring, like Bethesda, office development led the initial private investment response to MetroRail’s presence. Several major office buildings were developed, including the National Oceanic and Atmospheric Administration. Downtown Silver Spring also benefited from heightened interest in living near MetroRail. Apartment buildings near the MetroRail charge premium rents and close-in neighborhoods enjoy high occupancies.35 For the first 15 years of MetroRail service, Silver Spring’s office market flourished while the retail market faltered. The community experienced several false starts as developers attempted to bring major new retail to the downtown. In 1992, redevelopment of the former Hecht’s department store into the City Place off-price retail development brought new movie theaters and retailers to the core, but the project was not large enough on its own to stem the retail exodus.
Montgomery County planners responded by assembling and clearing large tracts of land for redevelopment within Silver Spring’s core. When Discovery Communications decided to consolidate its Bethesda offices into a single structure, major County incentives drew the company to the district surrounding the Silver Spring MetroRail station.
The move from upscale Bethesda to long-struggling Silver Spring did not go unnoticed by the region’s development community. Suddenly, Silver Spring became a hot spot. Renovation of the historic Silver Theatre attracted the American Film Institute and Roundhouse Theater, providing a new generator of pedestrian activity (see Figure 14).
Figure 14 Silver Spring, Maryland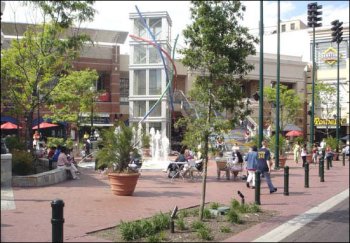
Currently, developers have entered into an agreement with Montgomery County for the “Downtown Silver Spring” development. The first phase of this mega-project included a new Whole Foods market; Strosnider’s Hardware; and several small restaurant, retail, and service operations. The second phase, currently under construction, will bring several new restaurants, a state-of-the-art 20-screen Majestic Theater, Border’s Books and Music, Pier1, other specialty retailers, new parking garages, and a new office tower to downtown Silver Spring. The retail space is all oriented to the street, emphasizing pedestrian access.
A new civic building and public plaza, a residential complex, a hotel, and a sports club will follow the first two phases. This downtown development, three blocks from the MetroRail station, is the culmination of years of revitalization efforts by the County as well as private investments. While the development is not adjacent to the transit station, the close-in neighborhoods and the business district’s office projects have all benefited from the proximity MetroRail service, creating the critical mass of both daytime and nighttime populations valuable to successful retailing.
Lessons Learned
The experiences of the transit agencies discussed above provide GCRTA with valuable lessons which can be applied without repeating the time- and money-consuming processes of attempting all approaches. Lessons consistently demonstrated in multiple locales are presented below, providing an empirical basis from which GCRTA can further its TOD initiatives. The objective of these lessons is to provide a framework to foster successful TOD, though no one existing TOD project may have had all the factors. The lessons are presented in three general categories, highlighting the importance of project stakeholders, the project design, and the community for which the project is proposed.
- Establishing Roles
- While a city planning agency’s role is more frequently “passive” (i.e., the agency zones the land but cannot choose who develops it), a transit agency has the opportunity to more actively direct the land development and, most important, to ensure that the land uses reinforce transit and vice versa.
- TOD is a team effort. The most successful projects involve municipal leadership that invested time, money, and political capital to achieve TOD, transit agencies willing to reach beyond traditional mission statements of transporting passengers, sophisticated, TOD-savvy developers, and extensive public outreach to existing communities. Coordination between these stakeholders must start early and occur often throughout the length of the in the planning process.
- A significant role of leadership is helping to make projects work financially. This should include implementation of TOD policy by creating zoning that allows for more density and mixed-use; making infrastructure improvements (most notably in public transit); and providing predictability and transparency in the form of plans, guidelines, and permissible uses and densities.
- Developing the Development
- Pay more attention to the program aspect of the project to ensure success of the retail and community uses. For example, identify local businesses that would be particularly appropriate for the project and then offer them reduced rent for a period of time to assist them in getting established.
- Expand the retail customer base to the surrounding area. Place small retail spaces along the street, rather than at a single, somewhat isolated, node at the station. Design pathways to provide direct access to nearby neighborhoods.
- Retailing follows rooftops, even in a transit-intense setting. While it is often an attractive component of a TOD, retailers and developers look to the amount and mix of housing nearby, more so than the transit connections, to evaluate retail feasibility. Most developers insist that retail spending far exceed that delivered through a transit connection alone. Encouraging housing along a transit corridor helps support additional retail, regardless of how the shoppers get there.
- Even a very small lot size can promote TOD concepts. The promotion of TOD on urban infill parcels creates an important opportunity for the revitalization of older urban communities and neighborhoods.
- Play to the Region’s Strengths
- Even in suburban communities, TOD can serve an important tool to achieve a broader community strategy of creating a sense of place. TOD neighborhoods provide gathering places, open spaces, and community resources frequently lacking in traditional suburban developments.
- A strong real estate market offers more opportunities for non-traditional development like TOD. However, once TOD is successful in a regional, the concept is more likely to be successful in other, weaker areas.
- TOD is an excellent opportunity for communities to expand their supply of affordable housing. With significant transit options within close proximity, households may not need a car (or may be able to eliminate second and third cars).
- Design housing for the target market. If the demographic is seniors, avoid multilevel townhouses with many stairs. If the market is empty-nesters, opt for familiar styles over contemporary design patterns. If multiple housing markets are sought, focusing family housing near playgrounds and focus seniors near appropriate community services.
- Some of the best TOD opportunities are on parking lots originally built for commuters. The impediment is that while in the eyes of the planners this is an interim use, in the eyes of the commuters and transit agencies, it is often seen as essential. A creative plan is needed to develop such accessible sites (in particular for regional stations) to ensure that if replacement parking is required, sufficient funding is secured and that the placement of such parking will not be a barrier to such development.
1 Transit Cooperative Research Program, 2004.
2 www.vta.org/projects/tod.html.
3 Urban Land Institute, Development Case Study Library—2003.
4 TCRP, 2004.
5 Ibid.
6 Dittmar & Ohland, 2004.
7 Urban Land Institute, Development Case Study Library—Mockingbird Station, 2002.
8 Ibid.
9 Ibid.
10 Ibid.
11 Ibid.
12 Boston Central Artery/Tunnel History: libraries.mit.edu.
13 TCRP, 2004.
14 www.mass.gov.
15 Lynton, Stephen. “The Other Metro: Baltimore Prepares to Open 1st Subway Section.” The Washington Post, 30 Oct 1983, B1.
16 Del Adams, MTA TOD Project Manager, (410) 865-1204.
17 “Transportation Secretary and Local Leaders Break Ground on Long-Awaited Metro Center at Owings Mills.” Maryland DOT press release. 7 July 2005.
18 www.metro-region.org.
19 Marc Guichard, Senior Joint Development Specialist, TOD Implementation Program, Metro.
20 TCRP, 2004.
21 Ibid.
22 2000 U.S. Census.
23 TCRP, 2004.
24 TCRP, 2004.
25 Ibid.
26 www.arlingtonvirginia.com.
27 Ibid.
28 Ibid.
29 Ibid.
30 Ibid.
31 Urban Land Institute, 2006.
32 Ibid.
33 Ibid.
34 Ibid.
35 TCRP, 2004.